技术指标综合评估
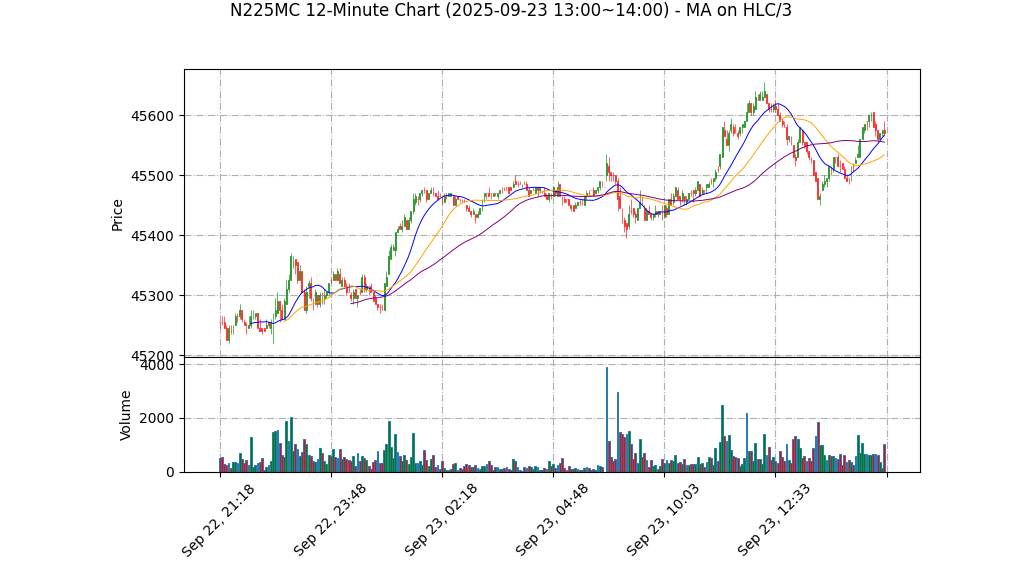
均线:收盘45585显著高于MA20=45404,价格-均线正差约+0.40%,给出中等偏强的趋势信号。鉴于MA仅提供方向性参考,赋予权重35%。
RSI:63.7位于中高区间(30-70内),动能偏多但未触及超买,倾向延续而非反转,权重25%。
MACD:柱值为正(9.054),且统计多头时间占比100%,显示动能偏多;但仅1条记录导致时序验证不足,权重30%(并下调置信)。
波动与一致性:波动率统计为0.00%多半因样本不足而失真;趋势一致性100%同样受样本偏差影响。此部分主要作为风险提示,权重10%。
综合:指标方向一致性偏多,但有效样本不足显著压低预测置信度。
趋势与形态分析
K线结构:当小时蜡烛实体小、区间仅15点(45575-45590),收于靠近高点(CLV≈0.67),显示轻度买盘主导但尚未形成强势扩展。短线呈“窄幅整理中的上沿试探”。
关键位:支撑—45575(小时低点)、45550(微结构支撑)、45404(MA20/趋势性支撑);阻力—45590(小时高点)、45600(整数位)。
若有效上破45590/45600并放量,倾向打开上行区间;若回落跌破45575,短线或转为区间震荡,回测45550甚至MA20一线。
时间周期分析
.historical-data-table {
width: 100%;
border-collapse: collapse;
font-family: ‘Segoe UI’, Tahoma, Geneva, Verdana, sans-serif;
font-size: 14px;
margin-top: 20px;
margin-bottom: 20px;
}
.historical-data-table th, .historical-data-table td {
border: 1px solid #ddd;
padding: 8px;
text-align: right;
}
.historical-data-table th {
background-color: #f2f2f2;
color: #333;
text-align: center;
}
.historical-data-table tr:nth-child(even){background-color: #f9f9f9;}
.historical-data-table tr:hover {background-color: #f1f1f1;}
.positive-score { color: #28a745; }
.negative-score { color: #dc3545; }
历史技术数据参考
| 时间 (北京) | 开盘价 | 最高价 | 最低价 | 收盘价 | 成交量 | MA20 | RSI14 | MACD柱 | 综合评分 |
|---|---|---|---|---|---|---|---|---|---|
| 09-23 14:00 | 45575.00 | 45590.00 | 45575.00 | 45585.00 | 435 | 45404.00 | 63.7 | 9.054 | 1.25 |